Stress Testing
The CBA uses top-down stress testing approach for financial stability purposes. This approach is concentrated on assessments of the resilience of the banking sector to credit and market risks on aggregate and bank level using reporting data from banks. Liquidity stress test is conducted separately. The solvency stress test is based on the 2 scenarios developed within the CBA (baseline and adverse), has a scenario length of 3 years and covers all the banks operating in Armenia. The results are used to assess overall resilience of the banking system, as well as serve as an input when calibrating Macro-prudential policy tools.
Adverse scenario usually tests whether the system can withstand a situation where severe shocks usually happen simultaneously. The adverse scenario, presented in the latest Financial stability report, assumed, that due to adverse economic developments in partner countries, Armenian exports may decline by around 22%, which will be coupled with 50% decline in remittances to Armenian economy. Simultaneously, the prices of imported goods, including that of oil and natural gas will rise, which will create price pressures in different segments of the economy. The scenario also assumed considerable rise of interest rates and inversion of the yield curve.
Taking into account the high level of risks already accumulated in real estate market, the stress scenario included assumption about adverse developments in this segment too. Specifically, it was assumed that in the context of worsening economic conditions this market will experience decline in demand and prices, which will in turn negatively affect the demand for mortgage loans on the one hand, and difficulties in servicing the existing loan payments on the other hand. At the same time, the mentioned decline of real estate prices will also affect the supply side: some real estate developers will have deterioration in their financial positions in terms of both servicing their existing business loans, and completion of ongoing real estate development projects.
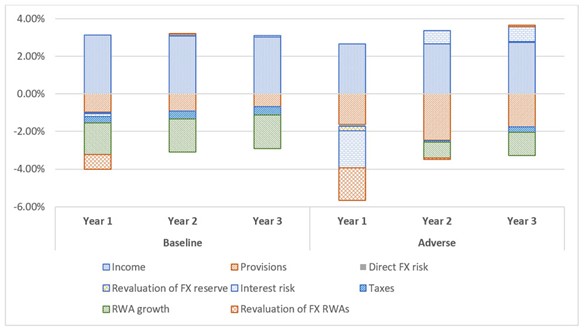
The results of this stress test are depicted in the charts below:
Figure 1: The distribution of capital adequacy ratios of banks in baseline and adverse scenarios
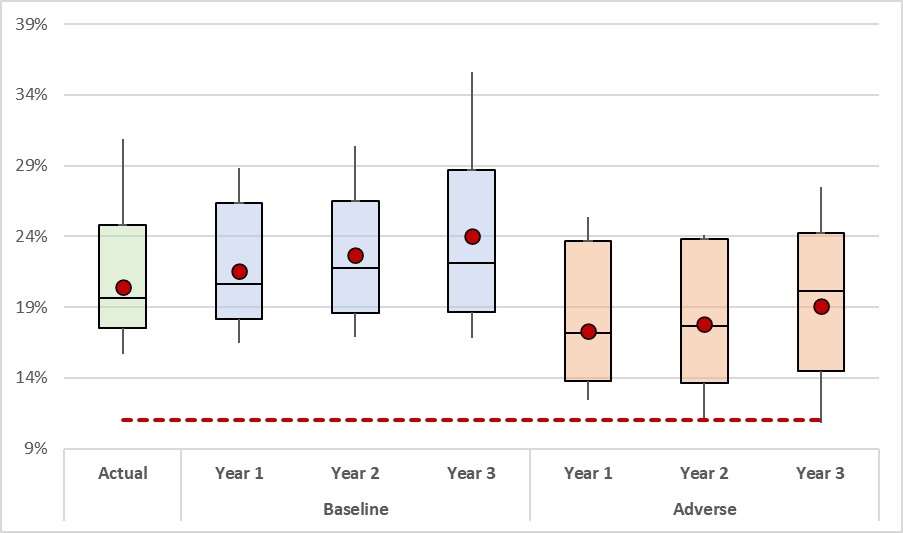
Figure 2: Decomposition of system capital adecuacy ratio by factors